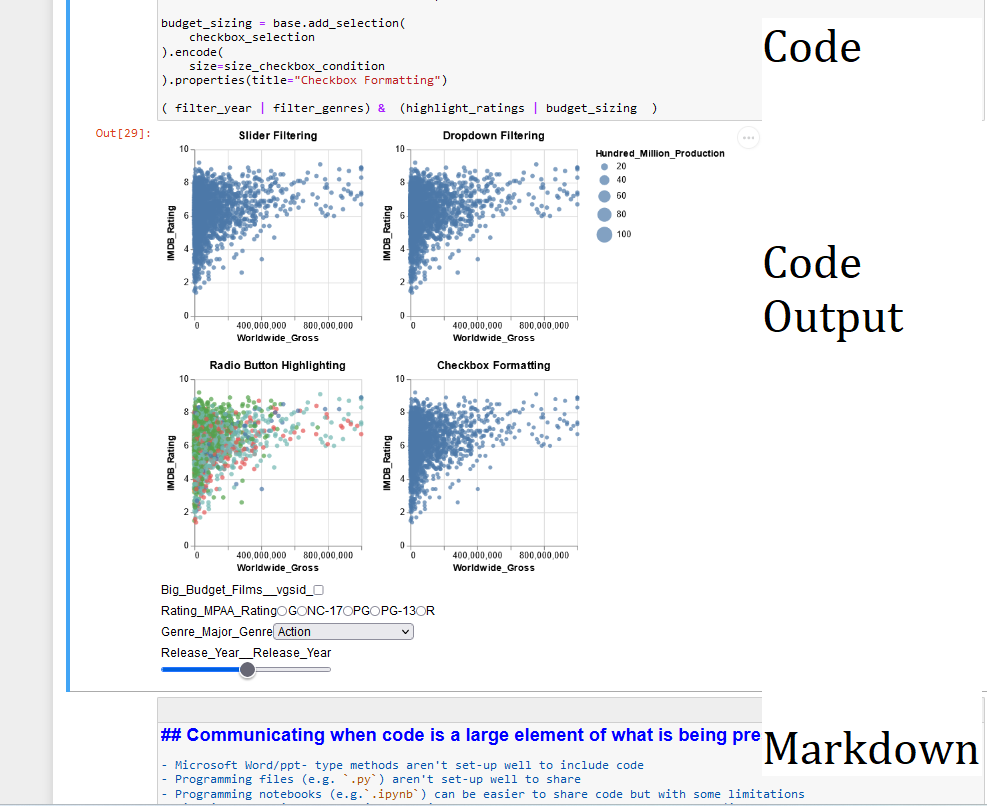
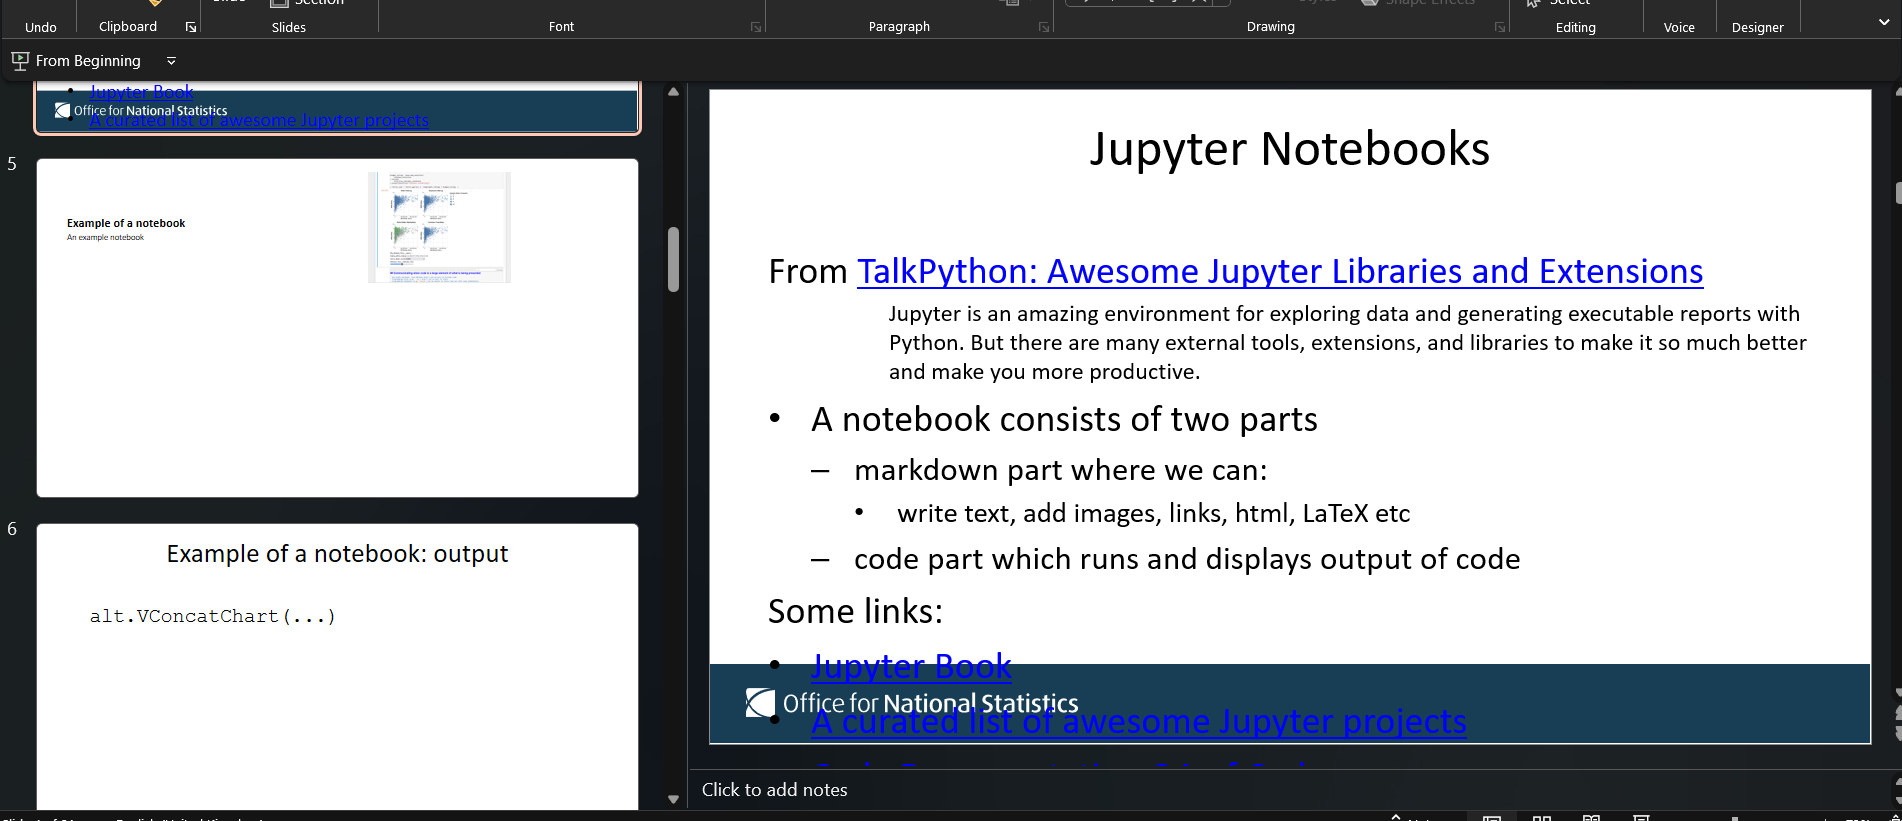
Jupyter is an amazing environment for exploring data and generating executable reports with Python. But there are many external tools, extensions, and libraries to make it so much better and make you more productive.
Although notebooks have their validish detractors I don’t like notebooks.- Joel Grus Youtube I think if you approach them in the right way they are a super powerful tool.
The negatives seem to be:
encourage bad practice in code (a genuine problem)
issues around order of what cell is run (easily got around with good practice)
issues around lack of auto complete (I don’t see the issue, use in visual studio autocomplete is there)
no grammar/spelling correction
issues with using git and version control
there are ways around this though
anything else?
Notebook Benefits
Notebooks are intuitive
You have the code then the result of the code
Can add text or images
And it’s linear
Can get things up and working quickly
Aid with communicating code
Encourages Writing
and writing things down aids thinking in the now and understanding what you did and why in the future
the reason I’m interested in it’s use is streamlit doesn’t seem to give flexibility to modify table output I’d like
Streamlit Overview
Streamlit is an open-source Python library that makes it easy to create and share beautiful, custom web apps for machine learning and data science. In just a few minutes you can build and deploy powerful data apps. So let’s get started!
Principally used to create apps, but some of the functionality works well for code/data presentations
But unlike some apps (am thinking MATLAB GUIs) you can’t create the look and functionality separately. So if you want something in a certain position it can be tricky. HTML can be used with st.markdown to give more control but it isn’t recommended to use by streamlit.
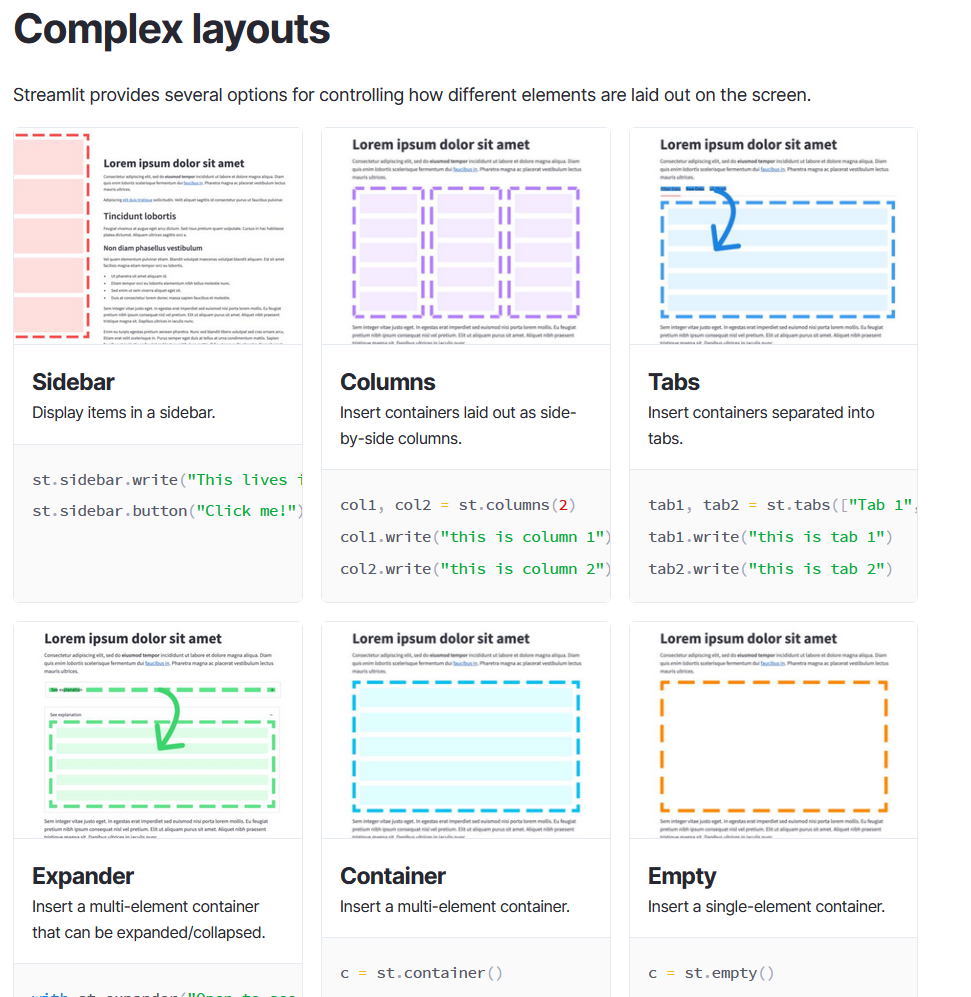
Instead, to create the layout as you would like they have the following features:
Streamlit Functionality: columns and sidebar
The most useable are the first two: columns and sidebar
Columns allows us to split the app vertically. The code is fairly simple:
Either colL, colM, colR = st.columns(3) for 3 equal columns or to split columns with different sizes:
colL, _, colR = st.columns((10, 5, 20))
with colL:
    st.write('On the left')
with colR:
    st.write('On the right twice as big as left')
st.sidebar just adds a sidebar to the app that can be hidden or shown.
Anything in the sidebar is just prefixed by st.sidebar so:
st.sidebar.write('I am in the sidebar')
st.write('I am in the main app')
st.sidebar.write('I am back in the sidebar')
Streamlit Functionality: html
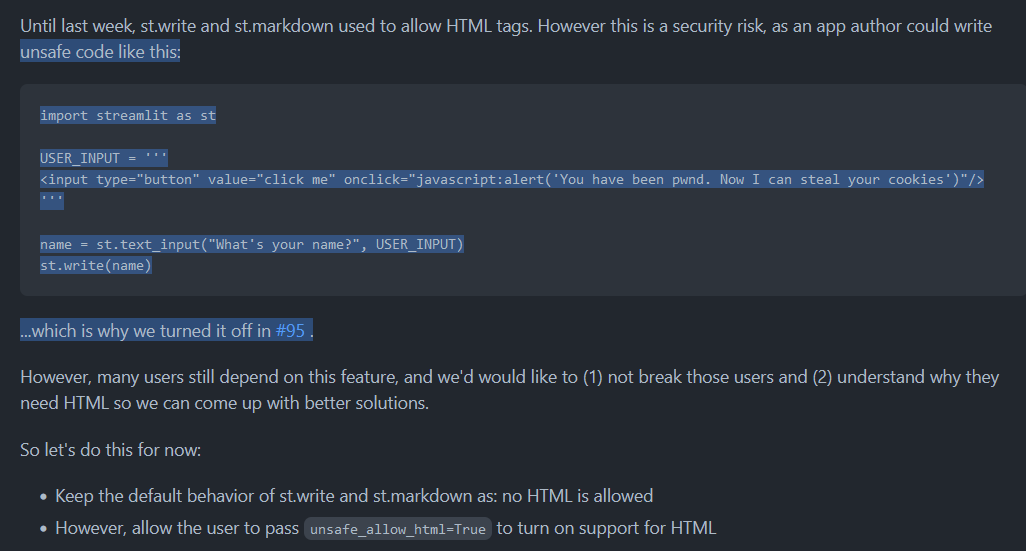
It is possible to add various additional personalisations using html. - BUT it does come with security risks and so is [not recommended]](https://github.com/streamlit/streamlit/issues/152)
Allows much more control over the layout of the app that can be useful for a presentation: - Can add a background image - Can add background color to a textbox - Control over positioning of widgets - lots more
HTML is implementated using st.markdown with unsafe_allow_html=True inside the former
Streamlit Functionality: html examples
add background to a text box
text = "Code Examples"
        st.markdown(f'<center><p style=font-family:"Calibri";background-color:#FFFFFF;color:#000000;font-size:42px;border-radius:10%><b>{text}</b></p></center>', unsafe_allow_html=True)
Or to add a background image
import streamlit as st
import base64

@st.cache(allow_output_mutation=True)
def get_base64_of_bin_file(bin_file):
    with open(bin_file, 'rb') as f:
        data = f.read()
    return base64.b64encode(data).decode()

def set_png_as_page_bg(png_file):
    bin_str = get_base64_of_bin_file(png_file)
    page_bg_img = '''
    <style>
    .stApp {
    background-image: url("data:image/png;base64,%s");
    background-size: contain;
    background-repeat: no-repeat;
    background-attachment: scroll; # doesn't work
    }
    </style>
    ''' % bin_str
    st.markdown(page_bg_img, unsafe_allow_html=True)
    return
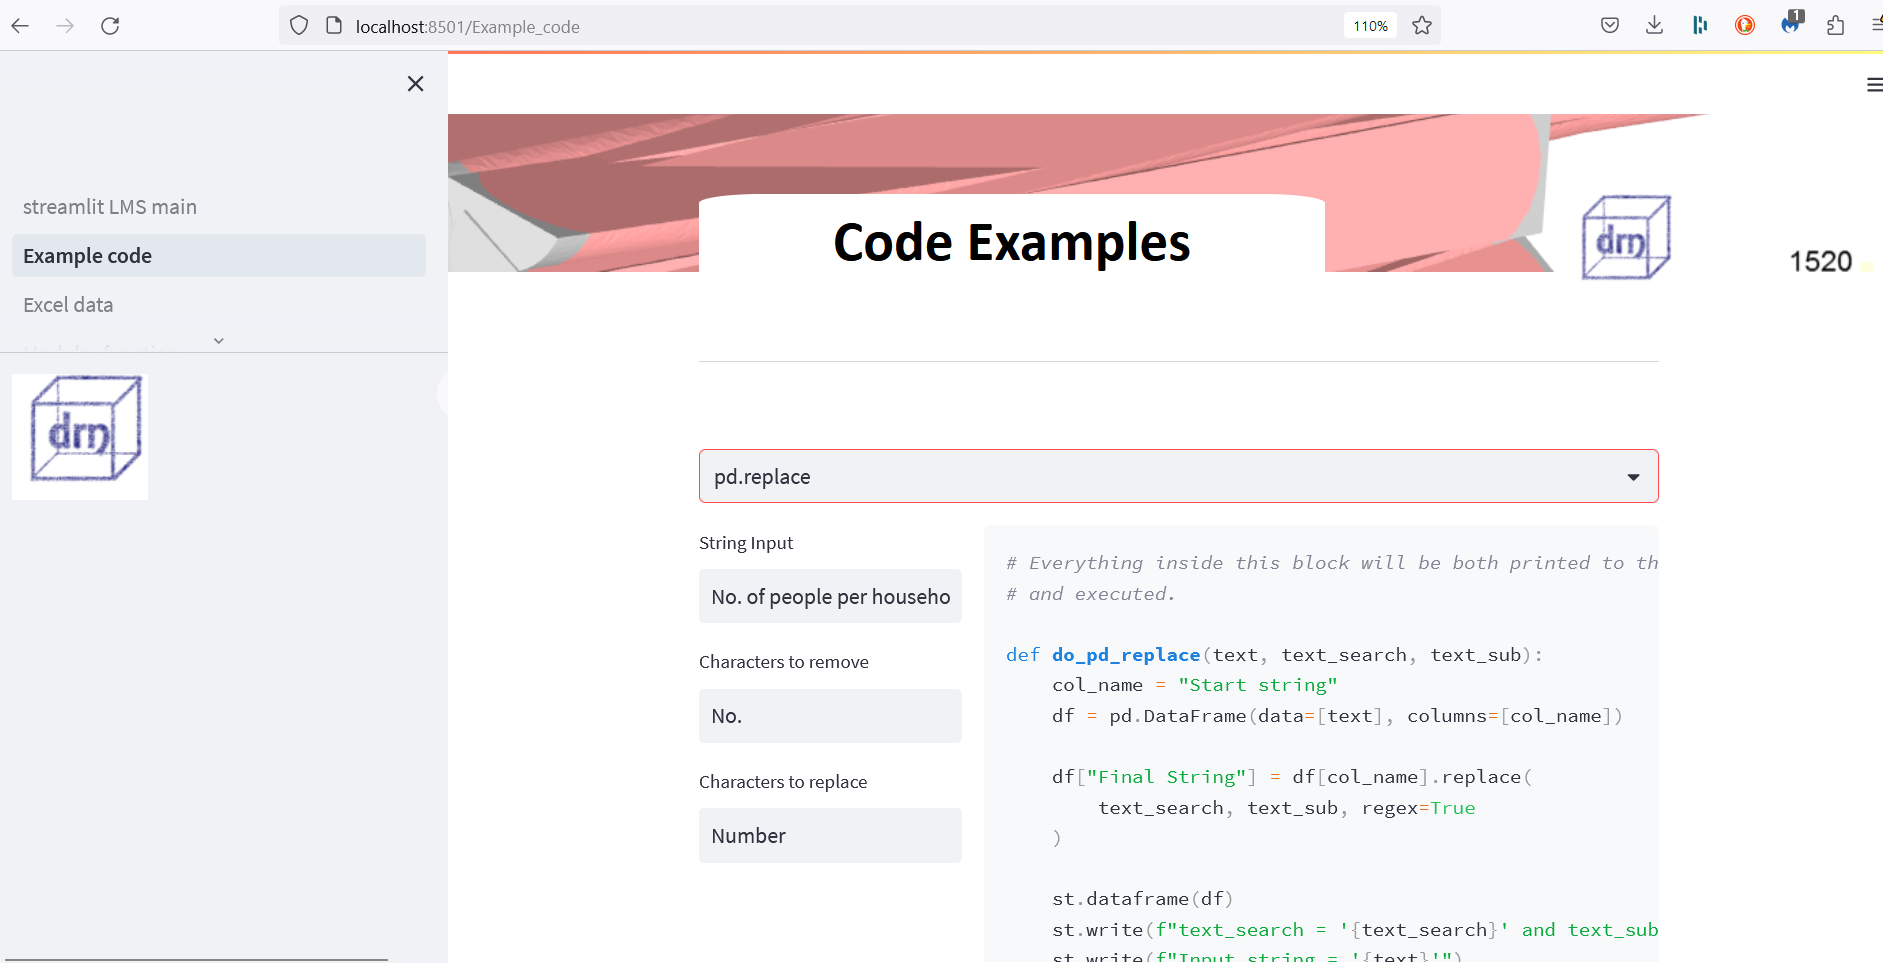
Streamlit Functionality: echo
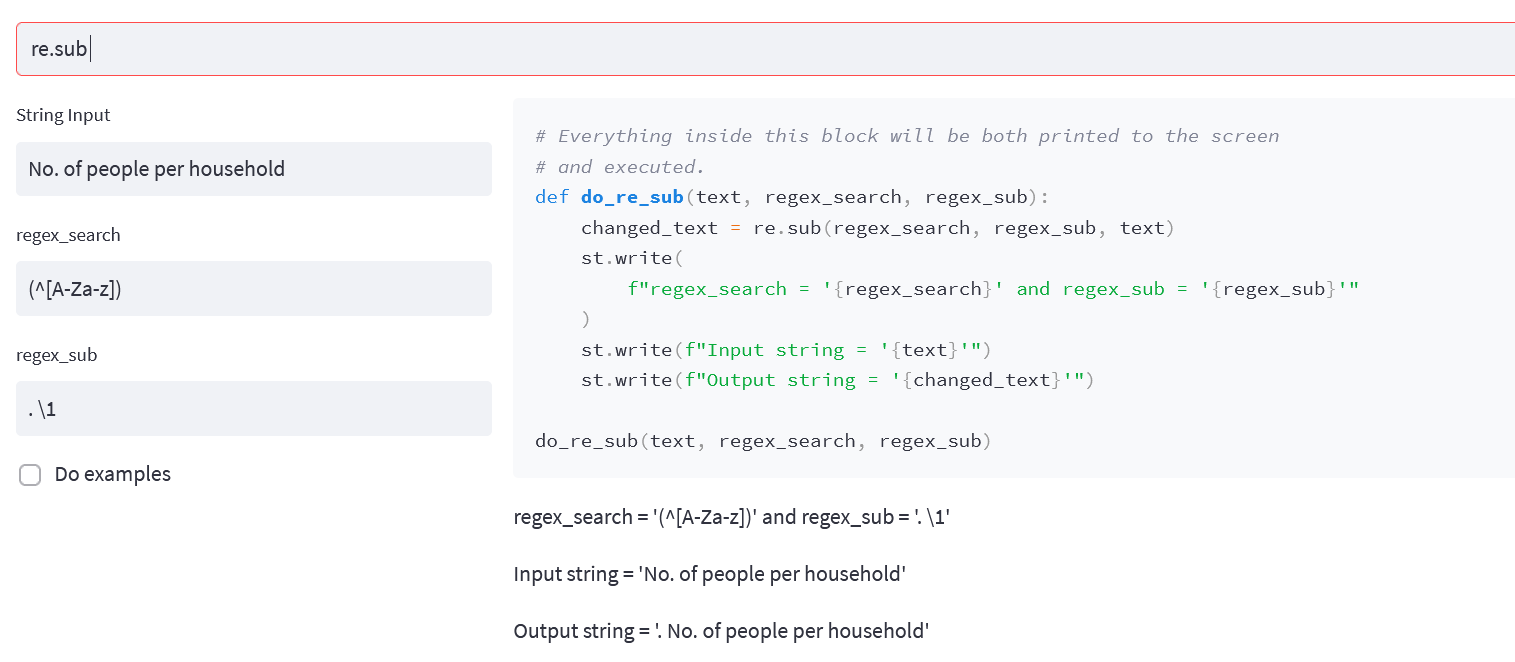
Sometimes you want your Streamlit app to contain both your usual Streamlit graphic elements and the code that generated those elements. That’s where st.echo() comes in
Easier to display this by an example:
In the example above the right of the image is given below (st.columns is used, where the input for the function is found from the left column).
st.echo is used with the with statement.
everything within the with is printed to the screen and executed
with st.echo():
    # Everything inside this block will be both printed to the screen
    # and executed.

    def do_pd_replace(text, text_search, text_sub):
        col_name = "Start string"
        df = pd.DataFrame(data=[text], columns=[col_name])

        df["Final String"] = df[col_name].replace(
            text_search, text_sub, regex=True
        )

        st.dataframe(df)
        st.write(f"text_search = '{text_search}' and text_sub = '{text_sub}'")
        st.write(f"Input string = '{text}'")
        st.write(f"Output string = '{df['Final String'].values[0]}'")

    do_pd_replace(text, text_search, text_sub)
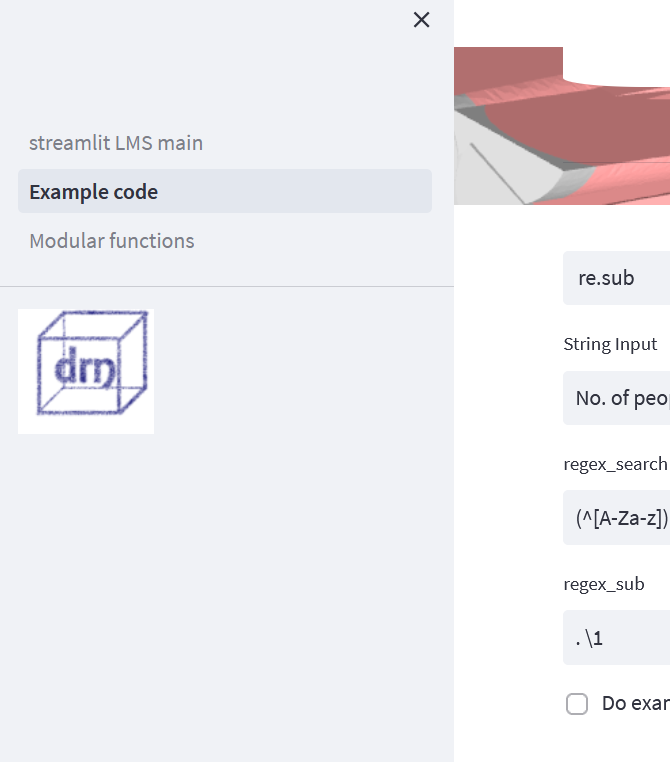
Streamlit Functionality: pages
By simply creating a folder called pages and putting other streamlit .py files in the folder they can then be accessed in the sidebar.
A main file needs to be outside the pages folder
The .py files in pages behave as if they were outside the folder (i.e. when loading files/functions)
Installation is via a package i.e. .msi for Windows or .pkg for Mac. Which can cause issues.
Works with both ipynb and qmd files, which are both a mixture of markdown and executable code.
The only thing that needs to be done with the notebook is add a YAML block at the start of the notebook, like the following (raq not markdown was used):
---
title: "Communicating code: Website"
subtitle: "Using the notebook format for a website"
author: "Thomas H. Simm"
format:
  html:
    toc: true
title-slide-attributes:
  data-background-size: contain
  data-background-opacity: "0.5"
jupyter: python3
---
We can create different files from this .ipynb Jupyter notebook using the following code:
quarto render testPres.ipynb --to pptx
quarto render testPres.ipynb --to pdf
quarto render testPres.ipynb --to html
quarto render testPres.ipynb --to revealjs
Quarto
Further, formatting for projects (i.e. for website) can be done within the configuration file_quarto.yml
The only difference in notebook is that it needs to have One header in a markdown cell for the table of contents, e.g.
# Title of page
Configuration file
A seperate files _config.yml is used to define how the html (or other) files will look
# Book settings
# Learn more at https://jupyterbook.org/customize/config.html

title: Defra Pesticide Testing, Data Analysis
author: Thomas Simm
logo: ONS-logo.png
exclude_patterns: [_build, Thumbs.db, .DS_Store, "**.ipynb_checkpoints"]


# Force re-execution of notebooks on each build.
# See https://jupyterbook.org/content/execute.html
execute:
  execute_notebooks: force

# Define the name of the latex output file for PDF builds
latex:
  latex_documents:
    targetname: book.tex

# Add a bibtex file so that we can create citations
bibtex_bibfiles:
  - references.bib

# Information about where the book exists on the web
repository:
  url: https://github.com/ThomasHSimm/Pesticide  # Online location of your book
  path_to_book: docs  # Optional path to your book, relative to the repository root
  branch: master  # Which branch of the repository should be used when creating links (optional)

# Add GitHub buttons to your book
# See https://jupyterbook.org/customize/config.html#add-a-link-to-your-repository
# HTML-specific settings
html:
  favicon                   : "_images/favicon.jpg"  # A path to a favicon image
  use_edit_page_button      : false  # Whether to add an "edit this page" button to pages. If `true`, repository information in repository: must be filled in
  use_repository_button     : false  # Whether to add a link to your repository button
  use_issues_button         : false  # Whether to add an "open an issue" button
  use_multitoc_numbering    : true   # Continuous numbering across parts/chapters
  extra_navbar              : Powered by <a href="https://jupyterbook.org">Jupyter Book</a>
                              <br>Home website <a href="https://thomashsimm.com/">thomashsimm.com</a> # Will be displayed underneath the left navbar.
  extra_footer              : ""  # Will be displayed underneath the footer.
  google_analytics_id       : ""  # A GA id that can be used to track book views.
  home_page_in_navbar       : true  # Whether to include your home page in the left Navigation Bar
  baseurl                   : ""  # The base URL where your book will be hosted. Used for creating image previews and social links. e.g.: https://mypage.com/mybook/
  comments:
    hypothesis              : false
    utterances              : false
  announcement              : "" # A banner announcement at the top of the site.
Table of content
And in addition to the config file a table of contents file is required _toc.yml:
# Table of contents
# Learn more at https://jupyterbook.org/customize/toc.html
format: jb-book
root: intro
chapters:
- file: Pesticide_Plots
- file: References
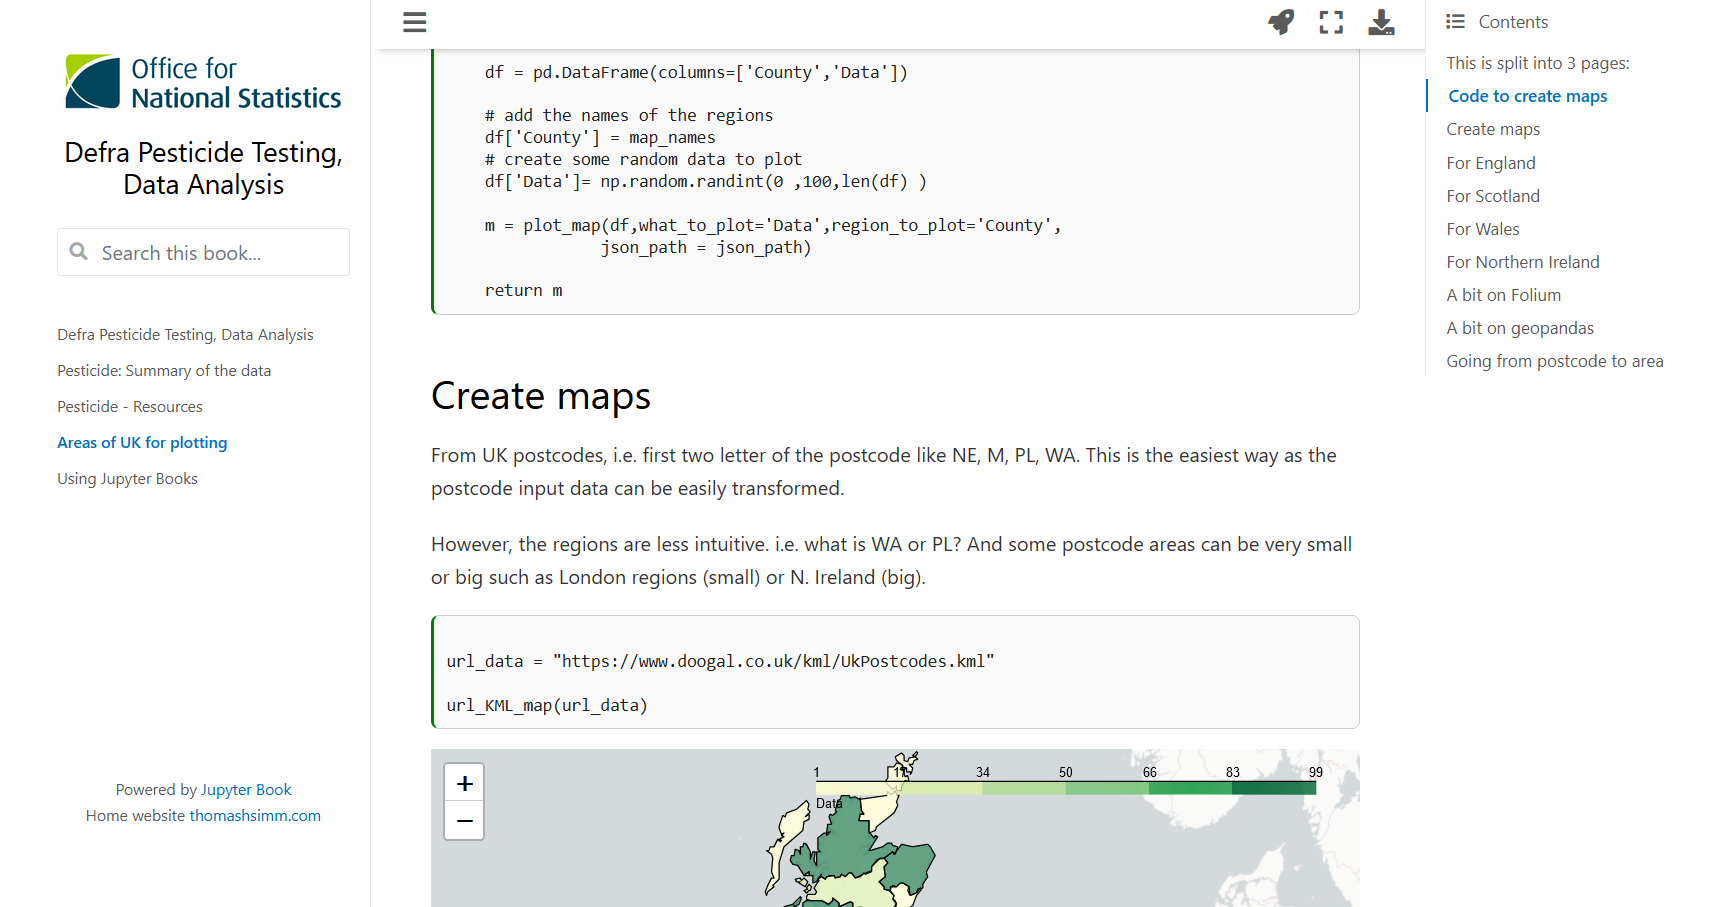
- file: UK_areas
- file: using_jupyter_books
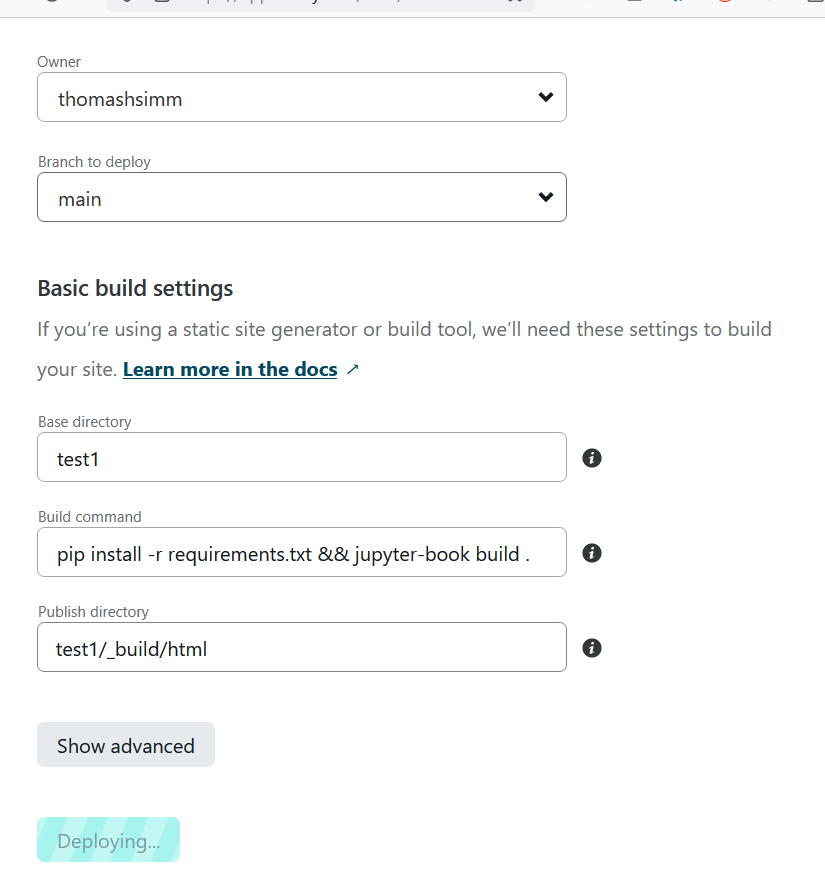
Creating a webpage from this
Takes about 30 mins including installing the chosen converter. (But can be done much quicker)
Quarto supports a variety of formats for creating presentations, including:
revealjs — reveal.js (HTML)
pptx — PowerPoint (MS Office)
beamer — Beamer (LaTeX/PDF)
I’ll consider the first two
Quarto PowerPoint overview
The steps to make a PowerPoint presentation from a notebook:
Create the inbuilt template.pptx file
Adjust it to match your own template
At the top of the notebook insert format for pptx including the template file
Choose how you will define a new page
You will probably need to manually check the slides and adjust as required
especially for interactive content and code
Creating the template
(Office info correct for Office 365 Feb 2023, Version 2301 Build 16.0.16026.20002)
If your workplace has a custom template or you have one you always use, you can incorporate this into quarto.
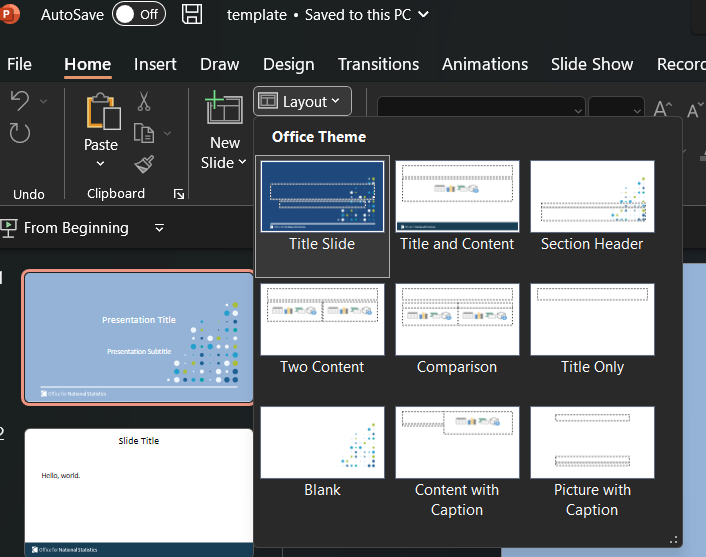
However, quarto is quite specific on the form this template takes, and requires the following elements
Title Slide
Title and Content
Section Header
Two Content
Comparison
Content with Caption
Blank
Creating a ppt template
By selecting Layout from the Home tab in powerpoint the different layouts can be seen
They can then be modified by going to View tab - Slide Master.
Creating a ppt template 2
If using your own template you will need to match the names of the slides given above. These can be found by hovering over the slides on the left or right clicking on one and selecting “Rename Layout”
Creating a ppt template 3
Alternatively, create a custom template using quarto and then modify this. The following command creates the template:
quarto pandoc -o template.pptx --print-default-data-file reference.pptx
Then go to View tab - Slide Master and modify each slide layout.
Note if you are trying to match a template, some tips: - go to Design -> Slide Size and match this to your template - when View tab - Slide Master is selected go to first tab (see above it will be left indented) on one you are copying from and select all on this then paste to the new template - these will be background images and other things that want to be passed to all slides - Check other slides for images and font-styles etc to match to the new template
Load the template
To load the template the first cell in the notebook needs to be modified as follows to reference the template.pptx file.
In addition, we can also specify here the rule by which a new slide is defined. If slide-level: 2 is used a new slide is defined by “##’ and a new section header by ‘#’. So if we used ‘###’ this would be a heading within the slide.
If slide-level: 1 is used a new slide is defined by “#’ and ‘##’ this would be a heading within the slide (this is normally the default).
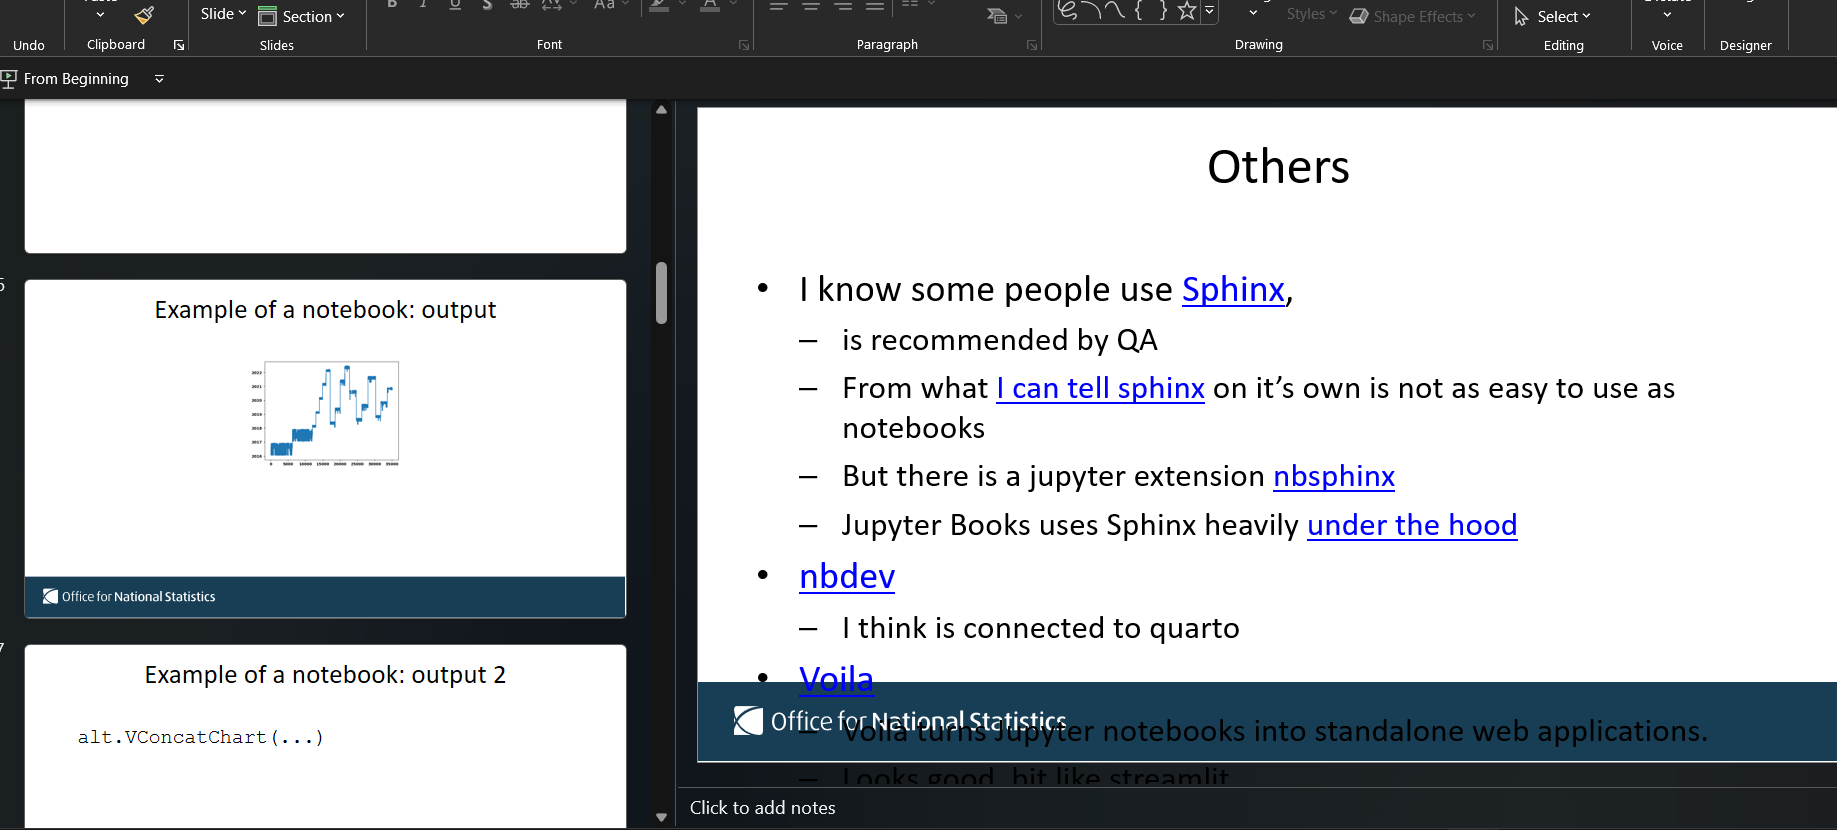
Check the slides
I have found creation of slides to powerpoint more prone to strange results than if .doc/.pdf/.html are used.
So check the slides, see if interactive content or code has been included (probably not) and if the slide content goes outside the slide.
In the example above - There is overlap of text on a slide - Strange ouput of a slide - Code output not displayed
Quarto HTML overview
With quarto two different html formats can be produced by using either html or revealjs.
revealjs does pretty much the same as a powerpoint file but is more robust - interactive content is included - less issues with getting format to fit within the slide
But - Can’t use the ppt template - And maybe(?) there are issues with sharing this format? - Interactive elements not as well implemeneted as within pure html
Adding style to revealjs
A simple way to add template like details to a revealjs file is to add a style.css sheet.
In the example below, the style sheet adds logo.png to the bottom right of each sheet
So this would then look like the following, with the logo (logo.png) in the bottom right, and size and positioning given by the css file
What the revealjs file looks like
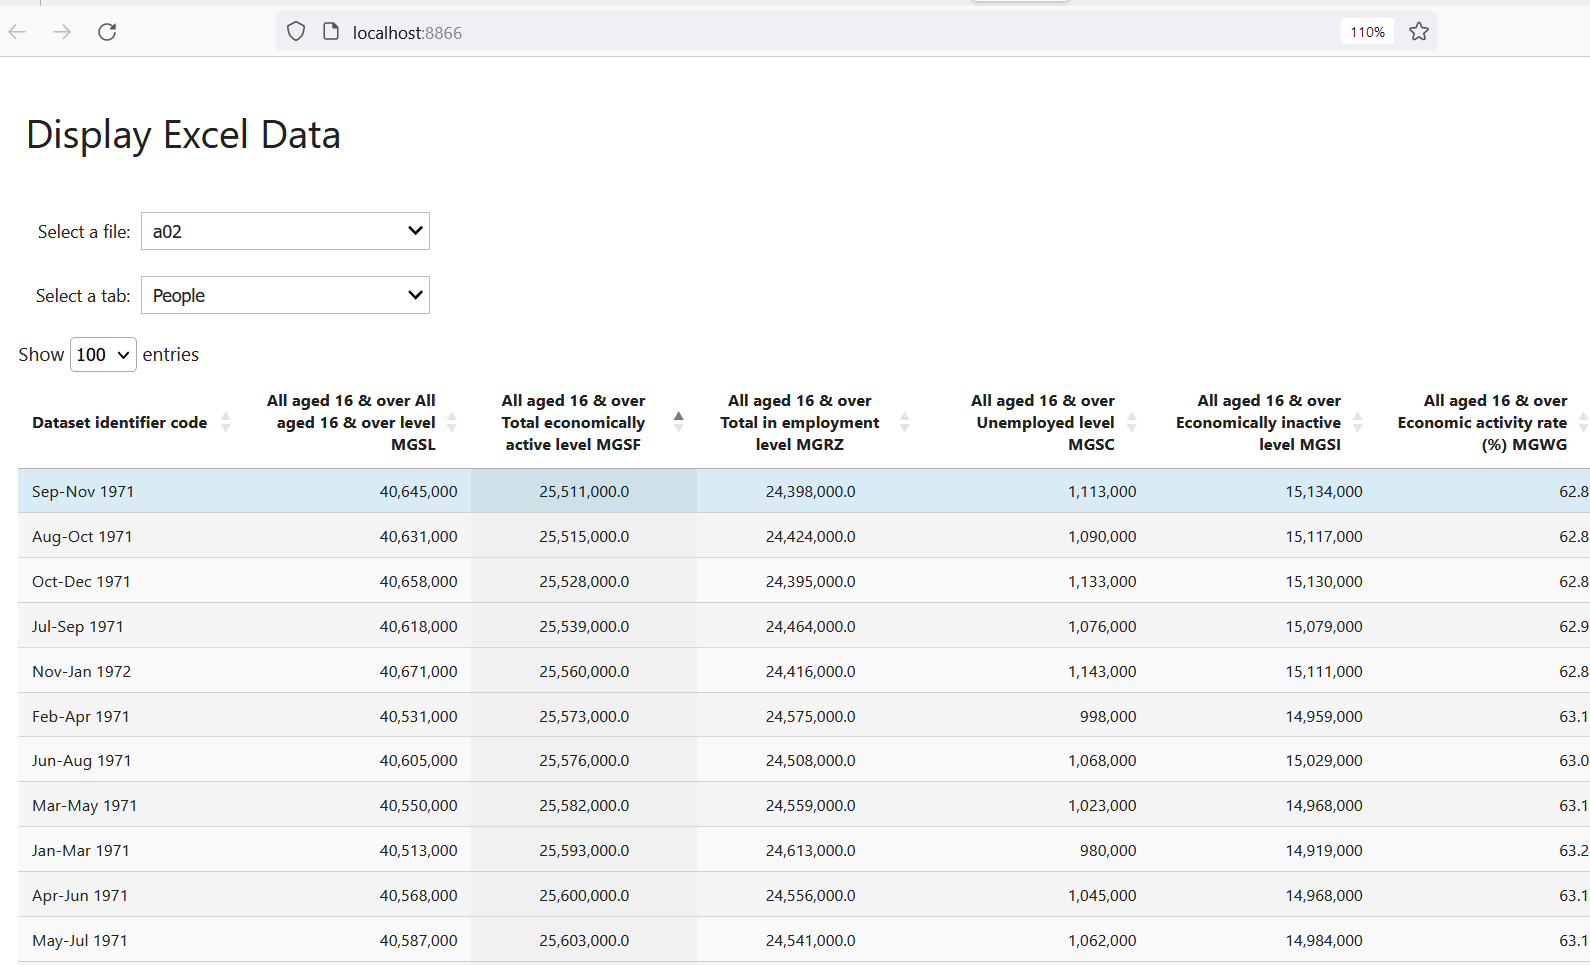
Tabular Data
How efficient is Excel when we are just viewing the data?
What other with code options to Excel are there?
Excel files
ChatGPT: What are the problems of Excel and xlsx files?
Limited scalability: Excel has a limit on the number of rows and columns it can handle effectively.
Inaccurate data: The manual nature of data entry in Excel can lead to errors and inaccuracies.
Fragility: Complex Excel spreadsheets can break easily if any formula or cell reference is altered.
Lack of security: Excel files are vulnerable to unauthorized access and malicious attacks.
Slow performance: Large and complex Excel files can become slow to open and use, leading to decreased productivity.
Compatibility issues: XLSX files may not be compatible with older versions of Excel, or with other software applications.
Limited collaboration: Sharing Excel files and making changes to them can be difficult, especially when multiple people are involved.
For me it is the Slow performance alongside: (a) we are doing the data manipulation outside Excel anyway and (b) having to have another application open
What aspect of tables I am considering
Loading data
ods with Excel
About 10 s to open 3 ods files with Excel
.ods converted to html in firefox browser
About 6 s to open 3 converted ods files in a browser
.ods converted to html firefox browser no new tabs
Almost instant when open converted ods files in same browser
Convert xlsx to html?
Opening xlsx files in Excel is slow
Converting to html if we don’t want to edit could be an option
If we are moving to Python/R aren’t non-Excel options worth considering??
Converting xlsx files to html
Seems the most obvious course
But it doesn’t seem that easy with code
but easy within Excel
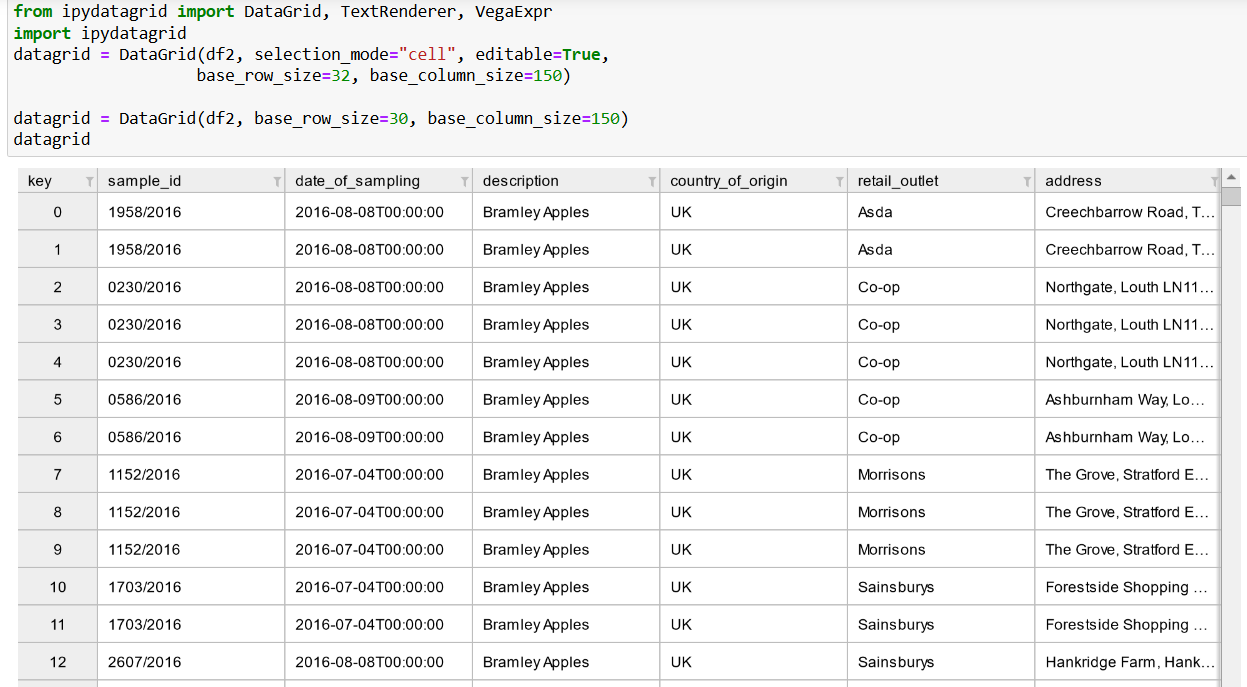
pandas
Since (in Python) we are mainly working with pandas. Let’s consider how pandas outputs can be modified.
# precision of all columns
pd.set_option("display.precision", 2)
# Or map as a string
df2['amount_pc_str'] = df2['amount_pc'].map(lambda x: '%.3f' % x)
# some other options
pd.set_option('max_colwidth', 20)
pd.set_option('display.max_columns', None)
pd.set_option('display.expand_frame_repr', False)
pd.set_option('max_colwidth', 0)
DataTables is a plug-in for the jQuery Javascript library. It is a highly flexible tool, built upon the foundations of progressive enhancement, that adds all of these advanced features to any HTML table.
If you are looking for Jupyter widgets, have a look at (taken from https://mwouts.github.io/itables/references.html) - QGrid by Quantopian - IPyaggrid by Louis Raison and Olivier Borderies - IPySheet by QuantStack.
More details on itables
From my brief review I found itables the best package
It works
It gives lots of control of table output to be consistent with good-practice