import pandas as pd

import os
from pathlib import Path
import sys

module_path = Path( os.getcwd() )
module_path = module_path.parent.parent.parent.__str__() + '\\Pesticide'

cwd = module_path

folder_path = os.path.join(cwd,'data')

sys.path.insert(0, module_path)

df2 = pd.read_csv(os.path.join(folder_path,'combined_df.csv') ,index_col=0 )
# change data type of columns
df2['date_of_sampling'] = pd.to_datetime(df2['date_of_sampling'])Communicating code: Tables
Communicating tabular data
Tabular Data
- How efficient is Excel when we are just viewing the data?
- What other with code options to Excel are there?
Excel files
ChatGPT: What are the problems of Excel and xlsx files?
Limited scalability: Excel has a limit on the number of rows and columns it can handle effectively.
Inaccurate data: The manual nature of data entry in Excel can lead to errors and inaccuracies.
Fragility: Complex Excel spreadsheets can break easily if any formula or cell reference is altered.
Lack of security: Excel files are vulnerable to unauthorized access and malicious attacks.
Slow performance: Large and complex Excel files can become slow to open and use, leading to decreased productivity.
Compatibility issues: XLSX files may not be compatible with older versions of Excel, or with other software applications.
Limited collaboration: Sharing Excel files and making changes to them can be difficult, especially when multiple people are involved.
For me it is the Slow performance alongside: (a) we are doing the data manipulation outside Excel anyway and (b) having to have another application open
ods with Excel
About 10 s to open 3 ods files with Excel
.ods converted to html in firefox browser
About 6 s to open 3 converted ods files in a browser
.ods converted to html firefox browser no new tabs
Almost instant when open converted ods files in same browser
What aspect of tables I am considering
Convert xlsx to html?
- Opening xlsx files in Excel is slow
- Converting to html if we don’t want to edit could be an option
- If we are moving to Python/R aren’t non-Excel options worth considering??
Converting xlsx files to html
- Seems the most obvious course
- But it doesn’t seem that easy with code
- but easy within Excel
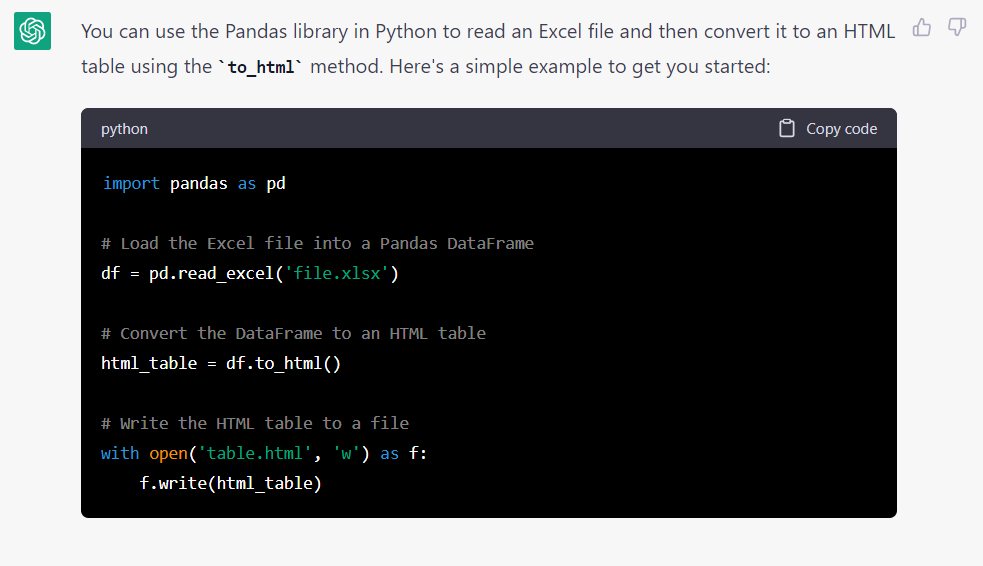
What does chatgpt say to convert excel file?
Convert an excel file to html with python
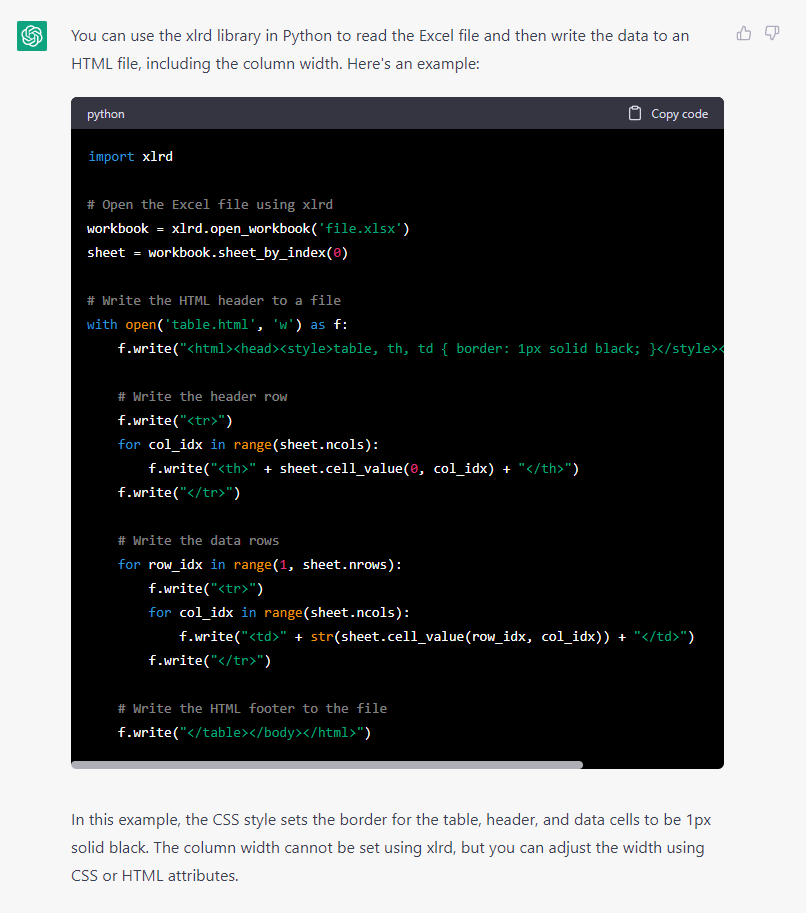
What does chatgpt say without pandas?
convert excel file to html in python without pandas include the excel formatting such as column width
pandas
- Since (in Python) we are mainly working with pandas. Let’s consider how pandas outputs can be modified.
- pandas options
Some code functionality
# precision of all columns
pd.set_option("display.precision", 2)
# Or map as a string
df2['amount_pc_str'] = df2['amount_pc'].map(lambda x: '%.3f' % x)
# some other options
pd.set_option('max_colwidth', 20)
pd.set_option('display.max_columns', None)
pd.set_option('display.expand_frame_repr', False)
pd.set_option('max_colwidth', 0)
pandas basic
df2| sample_id | date_of_sampling | description | country_of_origin | retail_outlet | address | brand_name | packer_/_manufacturer_/_importer | product | address_postcode | packer_postcode | address_area | packer_area | chem_name | amount_detected | mrl | amount_pc | |
|---|---|---|---|---|---|---|---|---|---|---|---|---|---|---|---|---|---|
| 0 | 1958/2016 | 2016-08-08 | Bramley Apples | UK | Asda | Creechbarrow Road, Taunton TA1 2AN | Asda | Asda Stores Ltd Leeds, UK LS11 5AD | Apple | TA1 2AN | LS11 5AD | Somerset | West Yorkshire | boscalid | 0.03 | 2.0 | 0.015 |
| 1 | 1958/2016 | 2016-08-08 | Bramley Apples | UK | Asda | Creechbarrow Road, Taunton TA1 2AN | Asda | Asda Stores Ltd Leeds, UK LS11 5AD | Apple | TA1 2AN | LS11 5AD | Somerset | West Yorkshire | pyraclostrobin | 0.01 | 0.5 | 0.020 |
| 2 | 0230/2016 | 2016-08-08 | Bramley Apples | UK | Co-op | Northgate, Louth LN11 0LT | Co-op | Co-operative Group Ltd Manchester M60 0AG | Apple | LN11 0LT | M60 0AG | Lincolnshire | Greater Manchester | boscalid | 0.05 | 2.0 | 0.025 |
| 3 | 0230/2016 | 2016-08-08 | Bramley Apples | UK | Co-op | Northgate, Louth LN11 0LT | Co-op | Co-operative Group Ltd Manchester M60 0AG | Apple | LN11 0LT | M60 0AG | Lincolnshire | Greater Manchester | flonicamid (sum) | 0.02 | 0.2 | 0.100 |
| 4 | 0230/2016 | 2016-08-08 | Bramley Apples | UK | Co-op | Northgate, Louth LN11 0LT | Co-op | Co-operative Group Ltd Manchester M60 0AG | Apple | LN11 0LT | M60 0AG | Lincolnshire | Greater Manchester | pyraclostrobin | 0.03 | 0.5 | 0.060 |
| ... | ... | ... | ... | ... | ... | ... | ... | ... | ... | ... | ... | ... | ... | ... | ... | ... | ... |
| 35155 | 2858/2020 Organic | 2020-10-20 | Organic Sweet Potatoes | Spain | Tesco | 300 Beverley Way, New Malden KT3 4PJ | Tesco | Tesco Stores Ltd Welwyn Garden City AL7 1GA | Sweet_Potatoes_Q4_(BNA) | KT3 4PJ | AL7 1GA | Greater London | Hertfordshire | 0 | 0.00 | 0.0 | 0.000 |
| 35156 | 0562/2020 Organic | 2020-10-05 | Organic Duchy Sweet Potatoes | Egypt | Waitrose | Mill Lane, Swindon SN1 7BX | Waitrose | Waitrose Ltd Doncastle Road, Bracknell, Berksh... | Sweet_Potatoes_Q4_(BNA) | SN1 7BX | RG12 8YA | Wiltshire | Berkshire | 0 | 0.00 | 0.0 | 0.000 |
| 35157 | 0563/2020 | 2020-10-05 | Sweet Potatoes | USA | Waitrose | Mill Lane, Swindon SN1 7BX | Waitrose | Waitrose Ltd Doncastle Road, Bracknell, Berksh... | Sweet_Potatoes_Q4_(BNA) | SN1 7BX | RG12 8YA | Wiltshire | Berkshire | 0 | 0.00 | 0.0 | 0.000 |
| 35158 | 2601/2020 | 2020-10-14 | Sweet Potatoes | USA | Waitrose | Ossington Way, Newark NG24 1FF | Waitrose | Waitrose Ltd Doncastle Road, Bracknell, Berksh... | Sweet_Potatoes_Q4_(BNA) | NG24 1FF | RG12 8YA | Nottinghamshire | Berkshire | 0 | 0.00 | 0.0 | 0.000 |
| 35159 | 2601/2020 | 2020-10-14 | Sweet Potatoes | USA | Waitrose | Ossington Way, Newark NG24 1FF | Waitrose | Waitrose Ltd Doncastle Road, Bracknell, Berksh... | Sweet_Potatoes_Q4_(BNA) | NG24 1FF | RG12 8YA | Nottinghamshire | Berkshire | 0 | 0.00 | 0.0 | 0.000 |
35160 rows × 17 columns
pandas overview
- Using pandas we can control various outputs
- But these still need a format to display within
- And display functionality is not easy
Or convert to a html file
df2.iloc[:500].to_html('df2_500.html')
But using a style sheet as shown in stack overflow by Parfait
df_out = df2.iloc[:500].copy()

pd.set_option('colheader_justify', 'center')   # FOR TABLE <th>

html_string = '''
<html>
  <head><title>HTML Pandas Dataframe with CSS</title></head>
  <link rel="stylesheet" type="text/css" href="df_style.css"/>
  <body>
    {table}
  </body>
</html>.
'''

# OUTPUT AN HTML FILE
with open('df2_500.html', 'w') as f:
    f.write(html_string.format(table=df_out.to_html(classes='mystyle')))
https://www.python-excel.org/
ipydatagrid
https://github.com/bloomberg/ipydatagrid
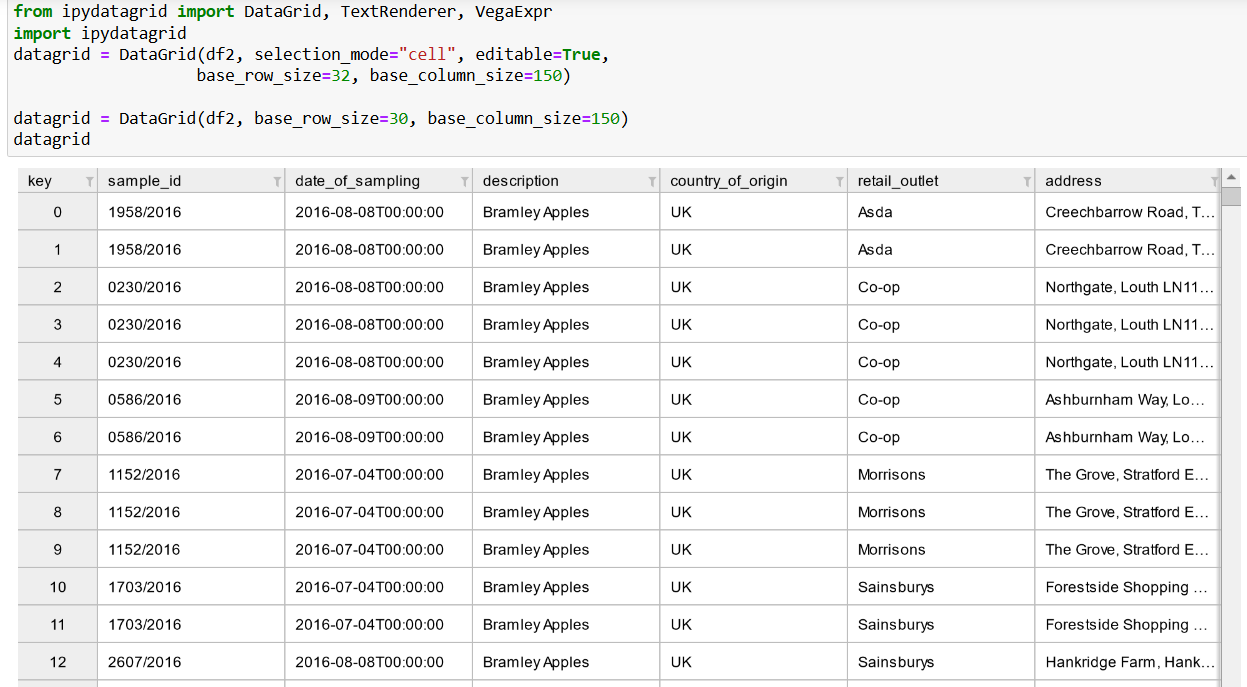
from ipydatagrid import DataGrid, TextRenderer, VegaExpr
import ipydatagrid
datagrid = DataGrid(df2, selection_mode="cell", editable=True,
                   base_row_size=32, base_column_size=150)

datagrid = DataGrid(df2, base_row_size=30, base_column_size=150)
datagrid
itables code
from itables import init_notebook_mode

import itables
init_notebook_mode(all_interactive=True)

itables.show(df2)
from itables import init_notebook_mode
import itables
init_notebook_mode(all_interactive=True)
itables.show(df2)| sample_id | date_of_sampling | description | country_of_origin | retail_outlet | address | brand_name | packer_/_manufacturer_/_importer | product | address_postcode | packer_postcode | address_area | packer_area | chem_name | amount_detected | mrl | amount_pc | |
|---|---|---|---|---|---|---|---|---|---|---|---|---|---|---|---|---|---|
| Loading... (need help?) |
Dash
https://dash.plotly.com/datatable
Downloaded 800,000 times per month, Dash is the original low-code framework for rapidly building data apps in Python, R, Julia, and F# (experimental).
https://medium.com/plotly/introducing-jupyterdash-811f1f57c02e
import plotly.express as px
from jupyter_dash import JupyterDash
import dash_core_components as dcc
import dash_html_components as html
from dash.dependencies import Input, Output# Load Data
df = px.data.tips()# Build App
app = JupyterDash(__name__)
app.layout = html.Div([
    html.H1("JupyterDash Demo"),
    dcc.Graph(id='graph'),
    html.Label([
        "colorscale",
        dcc.Dropdown(
            id='colorscale-dropdown', clearable=False,
            value='plasma', options=[
                {'label': c, 'value': c}
                for c in px.colors.named_colorscales()
            ])
    ]),
])# Define callback to update graph
@app.callback(
    Output('graph', 'figure'),
    [Input("colorscale-dropdown", "value")]
)
def update_figure(colorscale):
    return px.scatter(
        df, x="total_bill", y="tip", color="size",
        color_continuous_scale=colorscale,
        render_mode="webgl", title="Tips"
    )# Run app and display result inline in the notebook
app.run_server(mode='inline')
C:\Users\44781\AppData\Local\Temp\ipykernel_15260\3294666565.py:3: UserWarning:
The dash_core_components package is deprecated. Please replace
`import dash_core_components as dcc` with `from dash import dcc`
import dash_core_components as dcc
C:\Users\44781\AppData\Local\Temp\ipykernel_15260\3294666565.py:4: UserWarning:
The dash_html_components package is deprecated. Please replace
`import dash_html_components as html` with `from dash import html`
import dash_html_components as htmlStreamlit
A faster way to build and share data apps
- Dash can be run within a notebook but is principally an app.
- Streamlit is a similar app.
- But much easier to code.
import pandas as pd
import streamlit as st
all_dfs = pd.read_csv("./data/combined_df.csv")
st.dataframe(all_dfs.head())
And more
DataTables
DataTables is a plug-in for the jQuery Javascript library. It is a highly flexible tool, built upon the foundations of progressive enhancement, that adds all of these advanced features to any HTML table.
Jupyter widgets
If you are looking for Jupyter widgets, have a look at (taken from https://mwouts.github.io/itables/references.html) - QGrid by Quantopian - IPyaggrid by Louis Raison and Olivier Borderies - IPySheet by QuantStack.